Choose and defend the Phase 3 dose
- Delivery
- Up to 6 weeks from a clean dataset
- Price
- Fixed, quoted after the call
- Typical model risk
- High
What is at stake
The Phase 3 dose is one of the most expensive decisions in development, and in oncology FDA now expects it to rest on more than the maximum tolerated dose. A weak justification can mean more dose-finding before the pivotal trial can start.
Question of interest
Which dose and schedule should go into the registrational trial?
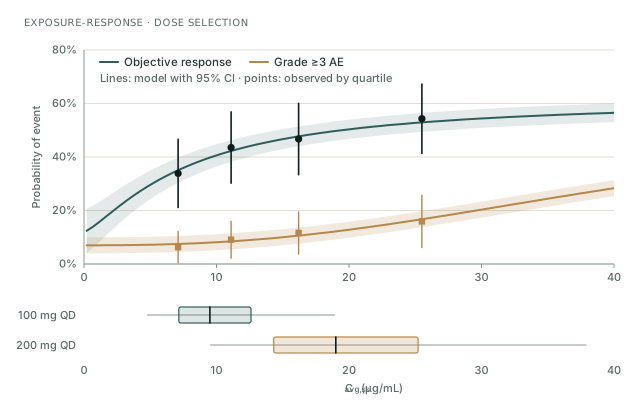
Population PK provides individual exposures. Exposure-response models for efficacy and safety predict outcomes at each candidate dose across the target population. The models complement the randomized dose comparison that FDA's oncology dosage-optimization guidance generally expects; they do not replace it.
What reviewers will ask
Is the exposure-response relationship confounded by disease severity?
Sicker patients often clear drug faster, especially for monoclonal antibodies, so low exposure can look like low efficacy. We test this with pre-specified covariate adjustment and case-matching, and lean on the randomized dose comparison where it exists.
Why this exposure metric?
Cavg, Cmin and Cmax are compared on criteria fixed in the analysis plan, and the choice is argued pharmacologically, not only by fit.
Does the benefit-risk hold in patients with high exposure?
We simulate exposure by covariate subgroup at each dose and show where each subgroup sits on both curves.
What you file with the agency
- Dose-justification section of the end-of-Phase-2 briefing document
- Population PK and exposure-response reports for Module 5.3.3.5
- M15 assessment table for the dose question
- Analysis datasets, define.xml and code for agency review
What we need from you
- PK, efficacy and safety data (SDTM, ADaM or raw, with specifications)
- Protocols, SAPs and any previous PK or E-R reports
- The development context: target product profile, candidate doses, meeting dates
What it may replace
Where randomized dose data and exposure-response data are adequate, the analysis can reduce the size or number of additional dose-ranging cohorts. It does not replace the randomized comparison of doses that FDA's oncology dosage-optimization guidance generally expects.
Is this the decision in front of you?
Fixed price, paid in two milestones. A guaranteed date. Agency questions on this analysis answered at no extra cost. Pricing · How we work